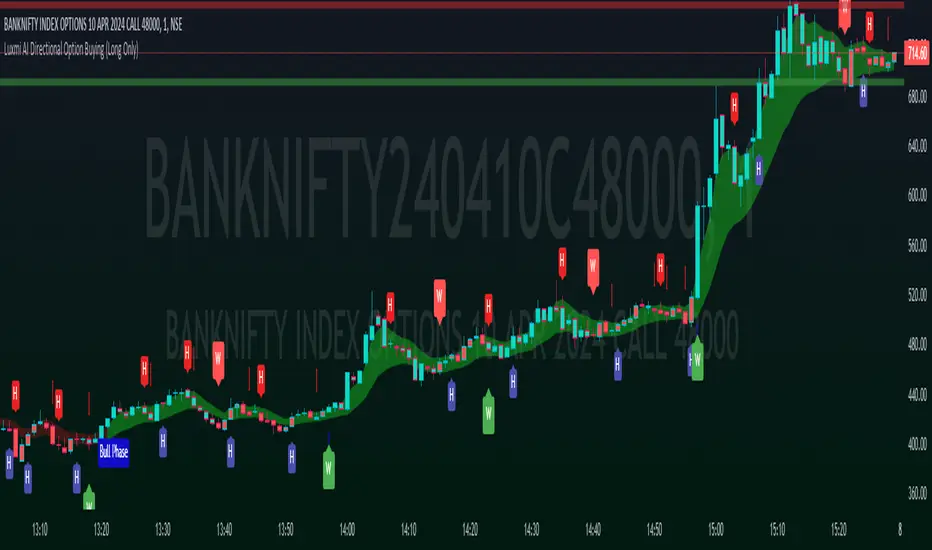
Luxmi AI Directional Option Buying (Long Only)Introduction:
"Option premium charts typically exhibit a predisposition towards bearish sentiment in higher timeframes"
In the dynamic world of options trading, navigating through the complexities of market trends and price movements is essential for making informed decisions. Among the arsenal of tools available to traders, option premium charts stand out as a pivotal source of insight, particularly in higher timeframes. However, their inherent bearish inclination in such timeframes necessitates a keen eye for identifying bullish pullbacks, especially in lower timeframes, to optimize buying strategies effectively.
Understanding the interplay between different data points becomes paramount in this endeavor. Traders embark on a journey of analysis, delving into metrics such as Implementation Shortfall, the performance of underlying index constituents, and bullish trends observed in lower timeframes like the 1-minute and 3-minute charts. These data points serve as guiding beacons, illuminating potential opportunities amidst the market's ever-shifting landscape.
Using this indicator, we will dissect the significance of option premium charts and their nuanced portrayal of market sentiment. Furthermore, we will unveil the art of discerning bullish pullbacks in lower timeframes, leveraging a multifaceted approach that amalgamates quantitative analysis with qualitative insights. Through this holistic perspective, traders can refine their decision-making processes, striving towards efficiency and efficacy in their options trading endeavors.
Major Features:
Implementation Shortfall (IS) Candles:
Working Principle:
TWAP (Time-Weighted Average Price) and EMA (Exponential Moving Average) are both commonly used in calculating Implementation Shortfall, a metric that measures the difference between the actual execution price of a trade and the benchmark price.
TWAP calculates the average price of a security over a specified time period, giving equal weight to each interval. On the other hand, EMA places more weight on recent prices, making it more responsive to current market conditions.
To calculate Implementation Shortfall using TWAP, the difference between the average execution price and the benchmark price is determined over the trading period. Similarly, with EMA, the difference is calculated using the exponential moving average price instead of a simple average.
By employing TWAP and EMA, traders can gauge the effectiveness of their trading strategies and identify areas for improvement in executing trades relative to a benchmark.
Benefits of using Implementation Shortfall:
By visualizing the implementation shortfall and its comparison with the EMA on the chart, traders can quickly assess whether current trading activity is deviating from recent trends.
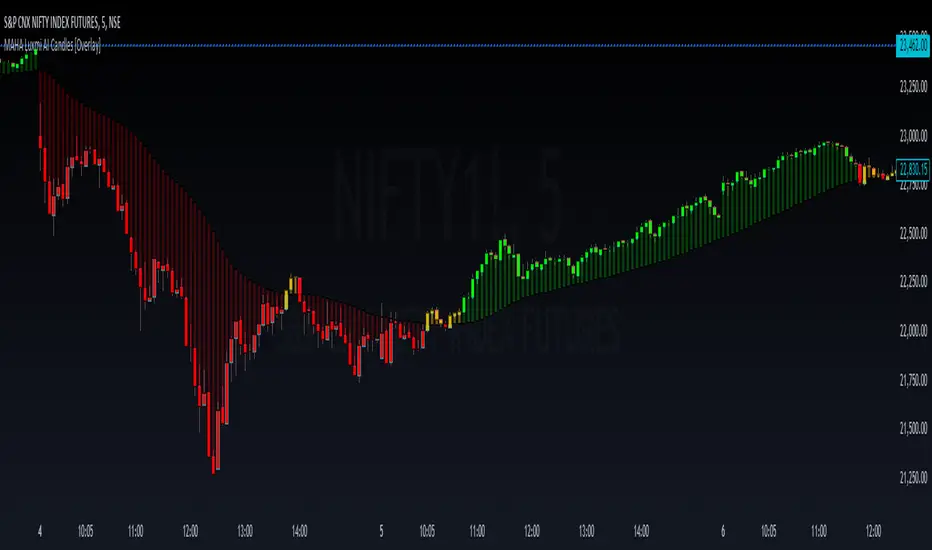
Green bars suggest potential buying opportunities or bullish sentiment, while red bars suggest potential selling opportunities or bearish sentiment.
Traders can use this visualization to make more informed decisions about their trading strategies, such as adjusting position sizes, entering or exiting trades, or managing risk based on the observed deviations from the moving average.
How to use this feature:
This feature calculates Implementation Shortfall (IS) and visually represents it by coloring the candles in either bullish (green) or bearish (red) hues. This color-coding system provides traders with a quick and intuitive way to assess market sentiment and potential entry points. Specifically, a long entry is signaled when both the candle color and the trend cloud color align as green, indicating a bullish market outlook. This integrated approach enables traders to make informed decisions, leveraging IS insights alongside visual cues for more effective trading strategies.
Micro Trend Candles:
Working Principle:
This feature begins by initializing variables to determine trend channel width and track price movements. Average True Range (ATR) is then calculated to measure market volatility, influencing the channel's size. Highs and lows are identified within a specified range, and trends are assessed based on price breaches, with potential changes signaled accordingly. The price channel is continually updated to adapt to market shifts, and arrows are placed to indicate potential entry points. Colors are assigned to represent bullish and bearish trends, dynamically adjusting based on current market conditions. Finally, candles on the chart are colored to visually depict the identified micro trend, offering traders an intuitive way to interpret market sentiment and potential entry opportunities.
Benefits of using Micro Trend Candles:
Traders can use these identified micro trends to spot potential short-term trading opportunities. For example:
Trend Following: Traders may decide to enter trades aligned with the prevailing micro trend. If the candles are consistently colored in a certain direction, traders may consider entering positions in that direction.
Reversals: Conversely, if the script signals a potential reversal by changing the candle colors, traders may anticipate trend reversals and adjust their trading strategies accordingly. For instance, they might close existing positions or enter new positions in anticipation of a trend reversal.
It's important to note that these micro trends are short-term in nature and may not always align with broader market trends. Therefore, traders utilizing this script should consider their trading timeframes and adjust their strategies accordingly.
How to use this feature:
This feature assigns colors to candles to represent bullish and bearish trends, with adjustments made based on current market conditions. Green candles accompanied by a green trend cloud signal a potential long entry, while red candles suggest caution, indicating a bearish trend. This visual representation allows traders to interpret market sentiment intuitively, identifying optimal entry points and exercising caution during potential downtrends.
Scalping Candles (Inspired by Elliott Wave):
Working Principle:
This feature draws inspiration from the Elliot Wave method, utilizing technical analysis techniques to discern potential market trends and sentiment shifts. It begins by calculating the variance between two Exponential Moving Averages (EMAs) of closing prices, mimicking Elliot Wave's focus on wave and trend analysis. The shorter-term EMA captures immediate price momentum, while the longer-term EMA reflects broader market trends. A smoother Exponential Moving Average (EMA) line, derived from the difference between these EMAs, aids in identifying short-term trend shifts or momentum reversals.
Benefits of using Scalping Candles Inspired by Elliott Wave:
The Elliott Wave principle is a form of technical analysis that attempts to predict future price movements by identifying patterns in market charts. It suggests that markets move in repetitive waves or cycles, and traders can potentially profit by recognizing these patterns.
While this script does not explicitly analyze Elliot Wave patterns, it is inspired by the principle's emphasis on trend analysis and market sentiment. By calculating and visualizing the difference between EMAs and assigning colors to candles based on this analysis, the script aims to provide traders with insights into potential market sentiment shifts, which can align with the broader philosophy of Elliott Wave analysis.
How to use this feature:
Candlestick colors are assigned based on the relationship between the EMA line and the variance. When the variance is below or equal to the EMA line, candles are colored red, suggesting a bearish sentiment. Conversely, when the variance is above the EMA line, candles are tinted green, indicating a bullish outlook. Though not explicitly analyzing Elliot Wave patterns, the script aligns with its principles of trend analysis and market sentiment interpretation. By offering visual cues on sentiment shifts, it provides traders with insights into potential trading opportunities, echoing Elliot Wave's emphasis on pattern recognition and trend analysis.
Volume Candles:
Working Principle:
This feature introduces a custom volume calculation method tailored for bullish and bearish bars, enabling a granular analysis of volume dynamics specific to different price movements. By summing volumes over specified periods for bullish and bearish bars, traders gain insights into the intensity of buying and selling pressures during these periods, facilitating a deeper understanding of market sentiment. Subsequently, the script computes the net volume, revealing the overall balance between buying and selling pressures. Positive net volume signifies prevailing bullish sentiment, while negative net volume indicates bearish sentiment.
Benefits of Using Volume candles:
Enhanced Volume Analysis: Traders gain a deeper understanding of volume dynamics specific to bullish and bearish price movements, allowing them to assess the intensity of buying and selling pressures with greater precision.
Insight into Market Sentiment: By computing net volume and analyzing its relationship with the Exponential Moving Average (EMA), traders obtain valuable insights into prevailing market sentiment. This helps in identifying potential shifts in sentiment and anticipating market movements.
Visual Representation of Sentiment: The color-coded candle bodies based on volume dynamics provide traders with a visual representation of market sentiment. This intuitive visualization helps in quickly interpreting sentiment shifts and making timely trading decisions.
How to use this feature:
This visual representation allows traders to quickly interpret market sentiment based on volume dynamics. Green candles indicate potential bullish sentiment, while red candles suggest bearish sentiment. The color-coded candle bodies help traders identify shifts in market sentiment and make informed trading decisions.
Smart Sentimeter Candles:
Working Principle:
The "Smart Sentimeter Candles" feature is a tool designed for market sentiment analysis using technical indicators. It begins by defining stock symbols from various sectors, allowing traders to select specific indices for sentiment analysis. The script then calculates the difference between two Exponential Moving Averages (EMAs) of the High-Low midpoint, capturing short-term momentum changes in the market. It computes the difference between current and previous values to capture momentum shifts over time.
Additionally, it calculates the Exponential Moving Average (EMA) of this difference to provide a smoothed representation of the prevailing trend in market momentum. Another EMA of this difference is calculated to offer an alternative perspective on longer-term momentum trends. Bar colors are determined based on the difference between current and previous values, with bullish and bearish sentiment represented by custom colors. Finally, sentiment candles are visualized on the chart, providing traders with a clear representation of market sentiment changes.
Benefits of Using Sentimeter Candles:
By analyzing index constituents, traders gain insights into the individual stocks that collectively influence the index's performance. This understanding is crucial for trading options as it helps traders tailor their strategies to specific sectors or stocks within the index.
Sector-Specific Analysis: Traders can focus on specific sectors by selecting relevant indices for sentiment analysis.
Momentum Identification: The script identifies short-term momentum changes in the market, aiding traders in spotting potential trend reversals or continuations.
Clear Visualization: Sentiment candles visually represent market sentiment changes, making it easier for traders to interpret and act upon sentiment trends.
How to use this feature:
Select Indices: Toggle the inputs to choose which indices (e.g., NIFTY, BANKNIFTY, FINNIFTY) to analyze.
Interpret Sentiment Candles: Monitor the color of sentiment candles on the chart. Green candles indicate bullish sentiment, while red candles suggest bearish sentiment.
Observe Momentum Changes: Pay attention to momentum changes identified by the difference between EMAs and their respective EMAs. Increasing bullish momentum may present buying opportunities, while increasing bearish momentum could signal potential sell-offs.
Trend Cloud:
Working Principle:
The script utilizes the Relative Strength Index (RSI) to assess market momentum, identifying bullish and bearish phases based on RSI readings. It calculates two boolean variables, bullmove and bearmove, which signal shifts in momentum direction by considering changes in the Exponential Moving Average (EMA) of the closing price. When RSI indicates bullish momentum and the closing price's EMA exhibits positive changes, bullmove is triggered, signifying the start of a bullish phase. Conversely, when RSI suggests bearish momentum and the closing price's EMA shows negative changes, bearmove is activated, marking the beginning of a bearish phase. This systematic approach helps in understanding the current trend of the price. The script visually emphasizes these phases on the chart using plot shape markers, providing traders with clear indications of trend shifts.
Benefits of Using Trend Cloud:
Comprehensive Momentum Assessment: The script offers a holistic view of market momentum by incorporating RSI readings and changes in the closing price's EMA, enabling traders to identify both bullish and bearish phases effectively.
Structured Trend Recognition: With the calculation of boolean variables, the script provides a structured approach to recognizing shifts in momentum direction, enhancing traders' ability to interpret market dynamics.
Visual Clarity: Plotshape markers visually highlight the start and end of bullish and bearish phases on the chart, facilitating easy identification of trend shifts and helping traders to stay informed.
Prompt Response: Traders can promptly react to changing market conditions as the script triggers alerts when bullish or bearish phases begin, allowing them to seize potential trading opportunities swiftly.
Informed Decision-Making: By integrating various indicators and visual cues, the script enables traders to make well-informed decisions and adapt their strategies according to prevailing market sentiment, ultimately enhancing their trading performance.
How to use this feature:
The most effective way to maximize the benefits of this feature is to use it in conjunction with other key indicators and visual cues. By combining the color-coded clouds, which indicate bullish and bearish sentiment, with other features such as IS candles, microtrend candles, volume candles, and sentimeter candles, traders can gain a comprehensive understanding of market dynamics. For instance, aligning the color of the clouds with the trend direction indicated by IS candles, microtrend candles, and sentimeter candles can provide confirmation of trend strength or potential reversals.
Furthermore, traders can leverage the trend cloud as a trailing stop-loss tool for long entries, enhancing risk management strategies. By adjusting the stop-loss level based on the color of the cloud, traders can trail their positions to capture potential profits while minimizing losses. For long entries, maintaining the position as long as the cloud remains green can help traders stay aligned with the prevailing bullish sentiment. Conversely, a shift in color from green to red serves as a signal to exit the position, indicating a potential reversal in market sentiment and minimizing potential losses. This integration of the trend cloud as a trailing stop-loss mechanism adds an additional layer of risk management to trading strategies, increasing the likelihood of successful trades while reducing exposure to adverse market movements.
Moreover, the red cloud serves as an indicator of decay in option premiums and potential theta effect, particularly relevant for options traders. When the cloud turns red, it suggests a decline in option prices and an increase in theta decay, highlighting the importance of managing options positions accordingly. Traders may consider adjusting their options strategies, such as rolling positions or closing out contracts, to mitigate the impact of theta decay and preserve capital. By incorporating this insight into options pricing dynamics, traders can make more informed decisions about their options trades.
Scalping Opportunities (UpArrow and DownArrow):
Working Principle:
The feature calculates candlestick values based on the open, high, low, and close prices of each bar. By comparing these derived candlestick values, it determines whether the current candlestick is bullish or bearish. Additionally, it signals when there is a change in the color (bullish or bearish) of the derived candlesticks compared to the previous bar, enabling traders to identify potential shifts in market sentiment. This is a long only strategy, hence the signals are plotted only when the Trend Cloud is Green (Bullish).
Benefits of using UpArrow and DownArrow:
Clear Visualization: By employing color-coded candlesticks, the script offers traders a visually intuitive representation of market sentiment, enabling quick interpretation of prevailing conditions.
Signal Identification: Its capability to detect shifts in market sentiment serves as a valuable tool for identifying potential trading opportunities, facilitating timely decision-making and execution.
Long-Only Strategy: The script selectively plots signals only when the trend cloud is green, aligning with a bullish bias and enabling traders to focus on long positions during favorable market conditions.
Up arrows indicate potential long entry points, complementing the bullish bias of the trend cloud. Conversely, down arrows signify an active pullback in progress, signaling caution and prompting traders to refrain from entering long positions during such periods.
How to use this feature:
Confirmation: Confirm bullish market conditions with the Trend Cloud indicator. Ensure alignment between trend cloud signals, candlestick colors, and arrow indicators for confident trading decisions.
Entry Signals: Look for buy signals within a green trend cloud, indicated by bullish candlestick color changes and up arrows, suggesting potential long entry points aligned with the prevailing bullish sentiment.
Wait Signals: Exercise caution when encountering down arrows, which signify wait signals or active pullbacks in progress. Avoid entering long positions during these periods to avoid potential losses.
Exit Strategy: Use trend cloud color changes as signals to exit long positions. When the trend cloud shifts color, consider closing out long positions to lock in profits or minimize losses.
Profit Management: It's important to book or lock in some profits early on in option buying. Consider taking partial profits when the trade is in your favor and trail the remaining position to maximize gains on favorable trades.
Risk Management: Implement stop-loss orders or trailing stops to manage risk effectively. Exit positions promptly if sentiment shifts or if price movements deviate from the established trend, safeguarding capital.
Up and Down Signals:
Working Principle:
This feature calculates Trailing Stoploss (TSL) using the Average True Range (ATR) to dynamically adjust the stop level based on price movements. It generates buy signals when the price crosses above the trailing stop and sell signals when it crosses below. These signals are plotted on the chart and trigger alerts, signaling potential trading opportunities. Additionally, the script selectively plots Up and Down signals only when the Implementation Shortfall Calculation identifies scalp opportunities, independent of the prevailing price trend.
Benefits of using Up and Down Signals:
Trailing Stoploss: The script employs an ATR-based trailing stop, allowing traders to adjust stop levels dynamically in response to changing market conditions, thereby maximizing profit potential and minimizing losses.
Clear Signal Generation: Buy and sell signals are generated based on price interactions with the trailing stop, providing clear indications of entry and exit points for traders to act upon.
Alert Notifications: The script triggers alerts when buy or sell signals are generated, ensuring traders remain informed of potential trading opportunities even when not actively monitoring the charts.
Scalping Opportunities: By incorporating Implementation Shortfall Calculation, the script identifies scalp opportunities, enabling traders to capitalize on short-term price movements irrespective of the prevailing trend.
How to use this feature:
Signal Interpretation: Interpret Up signals as opportunities to enter long positions when the price crosses above the trailing stop, and Down signals as cues to exit.
Alert Monitoring: Pay attention to alert notifications triggered by the script, indicating potential trading opportunities based on signal generation.
Scalping Strategy: When Up and Down signals are plotted alongside scalp opportunities identified by the Implementation Shortfall Calculation, consider scalping trades aligned with these signals for short-term profit-taking, regardless of the overall market trend.
Consideration of Trend Cloud: Remember that this feature does not account for the underlying trend provided by the Trend Cloud feature. Consequently, the take profit levels generated by the trailing stop may be smaller than those derived from trend-following strategies. It's advisable to supplement this feature with additional trend analysis to optimize profit-taking levels and enhance overall trading performance.
Chart Timeframe Support and Resistance:
Working Principle:
This feature serves to identify and visualize support and resistance levels on the chart, primarily based on the chosen Chart Timeframe (CTF). It allows users to specify parameters such as the number of bars considered on the left and right sides of each pivot point, as well as line width and label color. Moreover, users have the option to enable or disable the display of these levels. By utilizing functions to calculate pivot highs and lows within the specified timeframe, the script determines the highest high and lowest low surrounding each pivot point.
Additionally, it defines functions to create lines and labels for each detected support and resistance level. Notably, this feature incorporates a trading method that emphasizes the concept of resistance turning into support after breakouts, thereby providing valuable insights for traders employing such strategies. These lines are drawn on the chart, with colors indicating whether the level is above or below the current close price, aiding traders in visualizing key levels and making informed trading decisions.
Benefits of Chart Timeframe Support and Resistance:
Identification of Price Levels: Support and resistance levels help traders identify significant price levels where buying (support) and selling (resistance) pressure may intensify. These levels are often formed based on historical price movements and are regarded as areas of interest for traders.
Decision Making: Support and resistance levels assist traders in making informed trading decisions. By observing price reactions near these levels, traders can gauge market sentiment and adjust their strategies accordingly. For example, traders may choose to enter or exit positions, set stop-loss orders, or take profit targets based on price behavior around these levels.
Risk Management: Support and resistance levels aid in risk management by providing reference points for setting stop-loss orders. Traders often place stop-loss orders below support levels for long positions and above resistance levels for short positions to limit potential losses if the market moves against them.
How to use this feature:
Planning Long Positions: When considering long positions, it's advantageous to strategize when the price is in proximity to a support level identified by the script. This suggests a potential area of buying interest where traders may expect a bounce or reversal in price. Additionally, confirm the bullish bias by ensuring that the trend cloud is green, indicating favorable market conditions for long trades.
Waiting for Breakout: If long signals are generated near resistance levels detected by the script, exercise patience and wait for a breakout above the resistance. A breakout above resistance signifies potential strength in the upward momentum and may present a more opportune moment to enter long positions. This approach aligns with trading methodologies that emphasize confirmation of bullish momentum before initiating trades.
Settings:
The Index Constituent Analysis setting empowers users to input the constituents of a specific index, facilitating the analysis of market sentiments based on the performance of these individual components. An index serves as a statistical measure of changes in a portfolio of securities representing a particular market or sector, with constituents representing the individual assets or securities comprising the index.
By providing the constituent list, users gain insights into market sentiments by observing how each constituent performs within the broader index. This analysis aids traders and investors in understanding the underlying dynamics driving the index's movements, identifying trends or anomalies, and making informed decisions regarding their investment strategies.
This setting empowers users to customize their analysis based on specific indexes relevant to their trading or investment objectives, whether tracking a benchmark index, sector-specific index, or custom index. Analyzing constituent performance offers a valuable tool for market assessment and decision-making.
Example: BankNifty Index and Its Constituents
Illustratively, the BankNifty index represents the performance of the banking sector in India and includes major banks and financial institutions listed on the National Stock Exchange of India (NSE). Prominent constituents of the BankNifty index include:
State Bank of India (SBIN)
HDFC Bank
ICICI Bank
Kotak Mahindra Bank
Axis Bank
IndusInd Bank
Punjab National Bank (PNB)
Yes Bank
Federal Bank
IDFC First Bank
By utilizing the Index Constituent Analysis setting and inputting these constituent stocks of the BankNifty index, traders and investors can assess the individual performance of these banking stocks within the broader banking sector index. This analysis enables them to gauge market sentiments, identify trends, and make well-informed decisions regarding their trading or investment strategies in the banking sector.
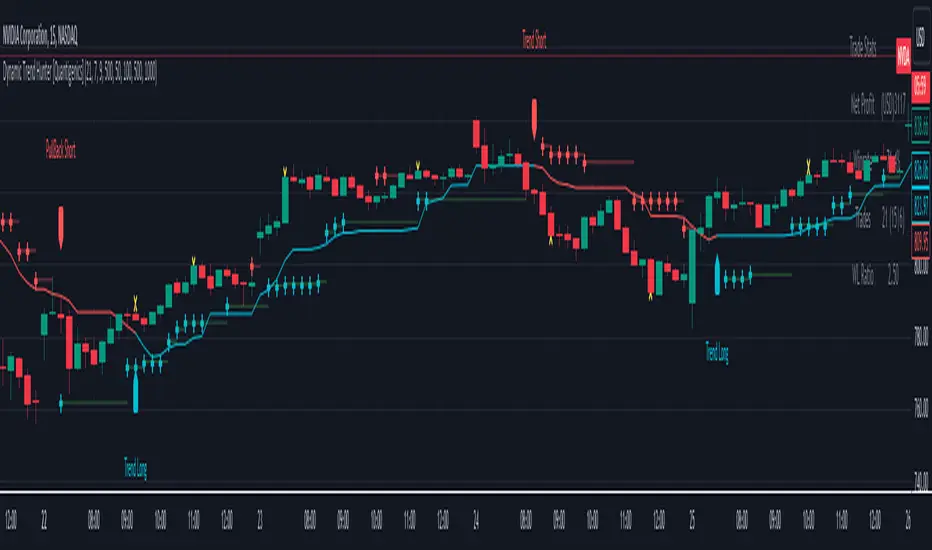
Example: NAS100 Index and Its Constituents
Similarly, the NAS100 index, known as the NASDAQ-100, tracks the performance of the largest non-financial companies listed on the NASDAQ stock exchange. Prominent constituents of the NAS100 index include technology and consumer discretionary stocks such as:
Apple Inc. (AAPL)
Microsoft Corporation (MSFT)
Amazon.com Inc. (AMZN)
Alphabet Inc. (GOOGL)
Facebook Inc. (FB)
Tesla Inc. (TSLA)
NVIDIA Corporation (NVDA)
PayPal Holdings Inc. (PYPL)
Netflix Inc. (NFLX)
Adobe Inc. (ADBE)
By inputting these constituent stocks of the NAS100 index into the Index Constituent Analysis setting, traders and investors can analyze the individual performance of these technology and consumer discretionary stocks within the broader NASDAQ-100 index. This analysis facilitates the evaluation of market sentiments, identification of trends, and informed decision-making regarding trading or investment strategies in the technology and consumer sectors.
Example: FTSE 100 Index and Its Constituents
The FTSE 100 index represents the performance of the 100 largest companies listed on the London Stock Exchange (LSE) by market capitalization. Some notable constituents of the FTSE 100 index include:
HSBC Holdings plc
BP plc
GlaxoSmithKline plc
Unilever plc
Royal Dutch Shell plc
AstraZeneca plc
Diageo plc
Rio Tinto plc
British American Tobacco plc
Reckitt Benckiser Group plc
By inputting these constituent stocks of the FTSE 100 index into the Index Constituent Analysis setting, traders and investors can analyze the individual performance of these diverse companies within the broader UK market index. This analysis facilitates the evaluation of market sentiments, identification of trends, and informed decision-making regarding trading or investment strategies in the UK market.
This comprehensive approach enables users to dissect index performance effectively, providing valuable insights for investors and traders across different markets and sectors.
Index Selection - Index Selection allows traders to specify the index for Sentimeter calculations, enabling customization for Call and Put Option charts corresponding to the chosen index.
Support and Resistance Levels - Set the left and right bars to consider pivot high and low to draw Support and resistance lines. Linewidth setting to help increase the width of the Support and Resistance lines. Label Color to change the color of the labels.
Style Section Colors to allow users to customize the color scheme to their liking.
Indicatore Pine Script®